
In any startup, having a clear and precise view of your financial health is crucial. For Chief Financial Officers (CFOs), leveraging advanced dashboards and key performance indicators (KPIs) can make all the difference in steering the company toward success. These CFO dashboards KPIs provide vital insights into the company’s financial status, helping executives make informed decisions, strategize effectively, and anticipate future challenges. This blog explores essential CFO dashboards KPIs, offering a roadmap for startups to optimize their financial performance and ensure sustained growth.
Table of Contents
What is a CFO Dashboard?
A CFO dashboard is a visual tool that consolidates and presents critical financial data and KPIs in a comprehensive and easy-to-understand format. It allows CFOs and executive teams to monitor the company’s financial health, track performance against targets, and identify trends and anomalies. These dashboards combine real-time data with powerful analytics, providing an indispensable resource for executive reporting and financial insights.
10 Essential CFO Dashboards KPIs
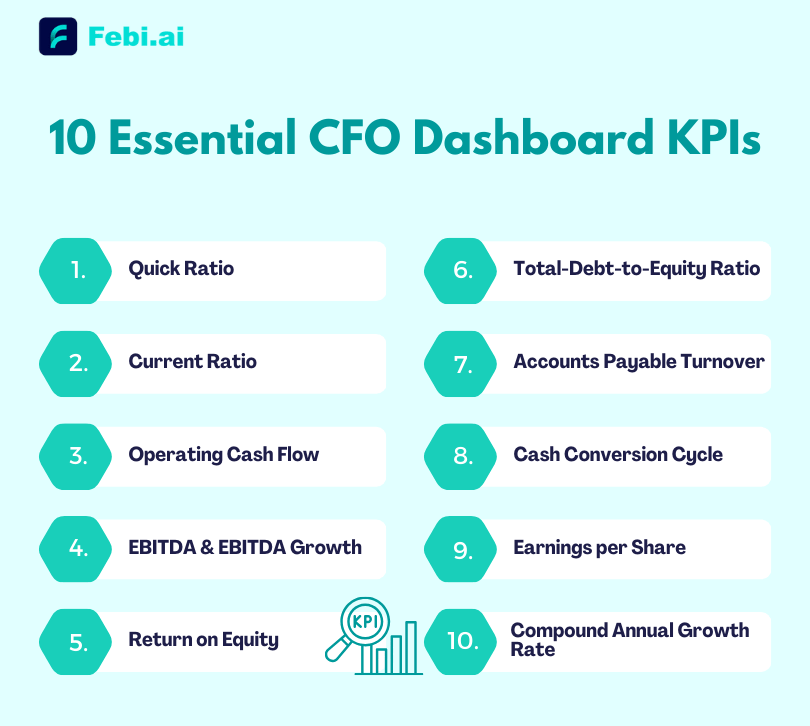
1. Quick Ratio
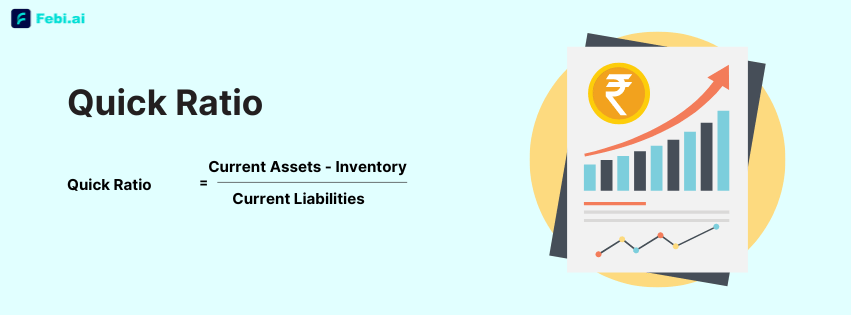
Quick Ratio measures a company’s ability to meet its short-term liabilities with its most liquid assets. It is calculated by dividing current assets minus inventories by current liabilities. This ratio is crucial for assessing liquidity and financial stability.
Why it’s important: A high quick ratio indicates a company can easily pay off its short-term debts, which is vital for maintaining creditor and investor confidence.
2. Current Ratio
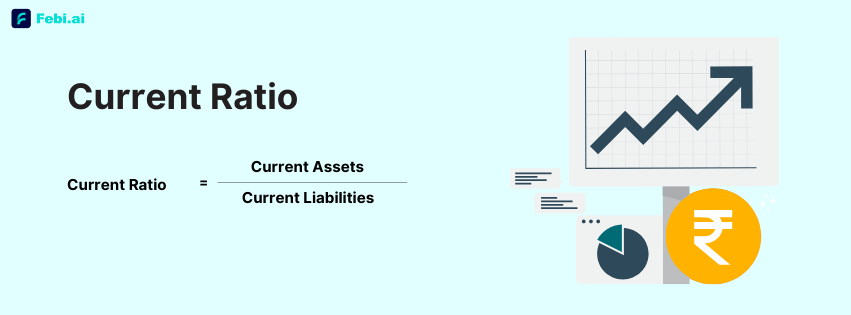
Current Ratio is the ratio of current assets to current liabilities. It provides a snapshot of a company’s ability to cover its short-term obligations with its short-term assets.
Why it’s important: This financial KPI helps in understanding the overall liquidity position and ensures that the company can meet its short-term liabilities.
3. Operating Cash Flow
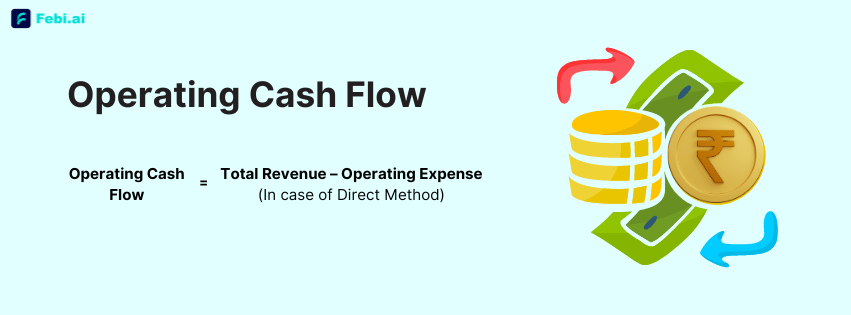
Operating Cash Flow is the cash generated from a company’s normal business operations. It indicates whether a company can generate sufficient positive cash flow to maintain and grow its operations.
Why it’s important: It highlights the company’s ability to generate cash from its core business activities, essential for maintaining liquidity and funding operations.
4. EBITDA & EBITDA Growth
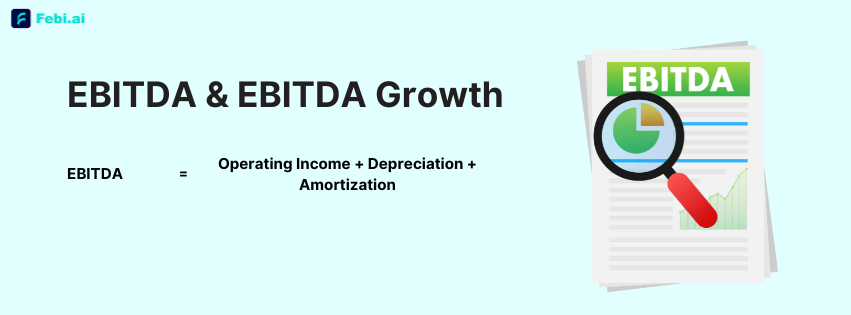
EBITDA (Earnings Before Interest, Taxes, Depreciation, and Amortization) measures a company’s overall financial performance. EBITDA growth indicates the company’s earnings growth over time.
Why it’s important: It provides a clear view of operational profitability and is commonly used to compare profitability between companies and industries.
5. Return on Equity
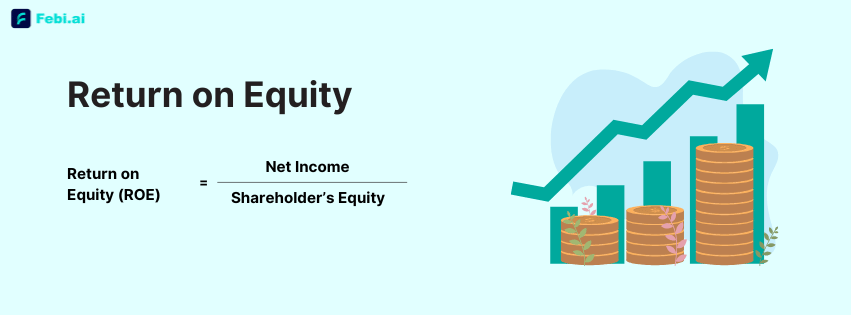
Return on Equity (ROE) measures the profitability of a company in generating profits from its shareholders’ equity.
Why it’s important: A higher ROE indicates efficient use of equity capital and is an important metric for investors.
6. Total Debt-to-Equity Ratio
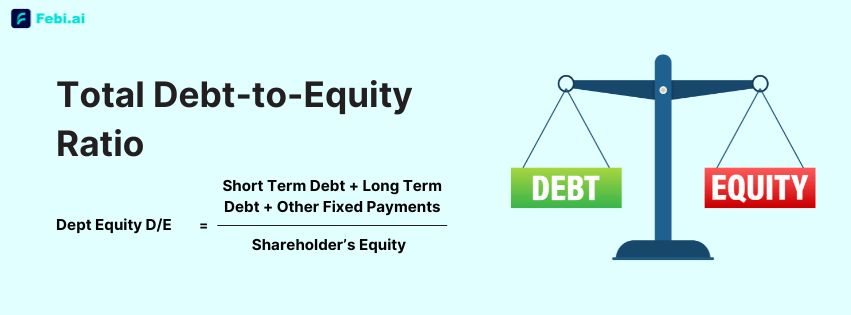
Total Debt-to-Equity Ratio compares a company’s total debt to its total equity. It indicates the relative proportion of shareholders’ equity and debt used to finance the company’s assets.
Why it’s important: A lower ratio suggests a more financially stable company with less reliance on debt financing.
7. Accounts Payable Turnover
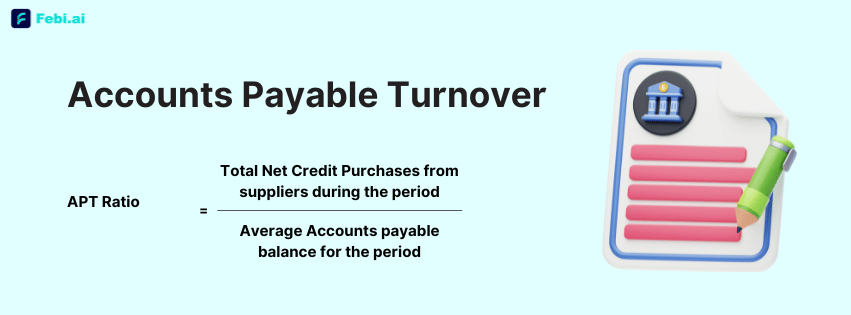
Accounts Payable Turnover measures how quickly a company pays off its suppliers. It is calculated by dividing total supplier purchases by the average accounts payable during the period.
Why it’s important: A higher turnover ratio indicates efficient payment practices and good supplier relationships.
8. Cash Conversion Cycle
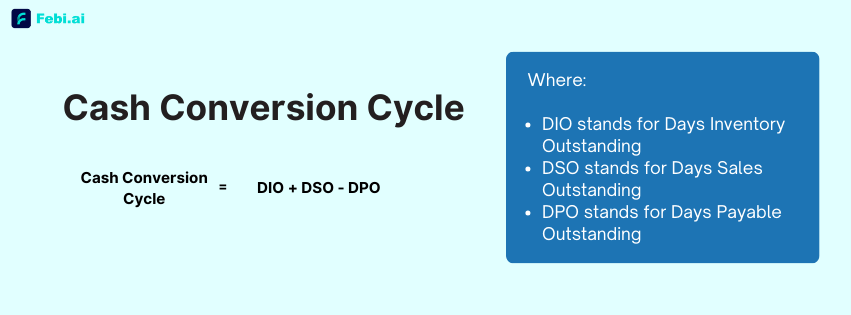
Cash Conversion Cycle (CCC) measures the time taken to convert inventory into cash flows from sales. It is calculated as the sum of the inventory turnover period and receivables collection period, minus the payables period.
Why it’s important: A shorter CCC indicates better efficiency in managing inventory and receivables.
9. Earnings per Share
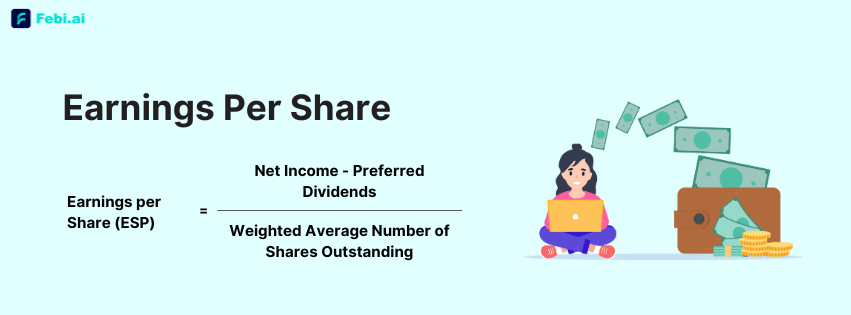
Earnings per Share (EPS) is calculated by dividing net earnings by the number of outstanding shares. It measures a company’s profitability on a per-share basis.
Why it’s important: EPS is a key indicator of a company’s profitability and is widely used by investors to assess financial performance.
10. Compound Annual Growth Rate
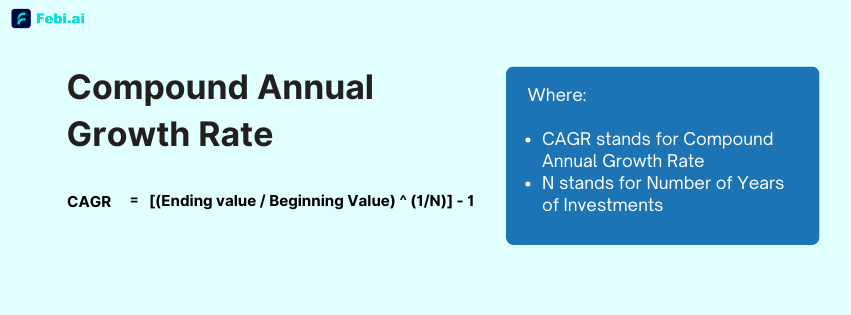
Compound Annual Growth Rate (CAGR) measures the annual growth rate of an investment over a specified period of time longer than one year.
Why it’s important: CAGR provides a smoothed annual growth rate that eliminates the effects of volatility and provides a clearer picture of growth over time.
Benefits of Effective CFO Dashboards KPIs
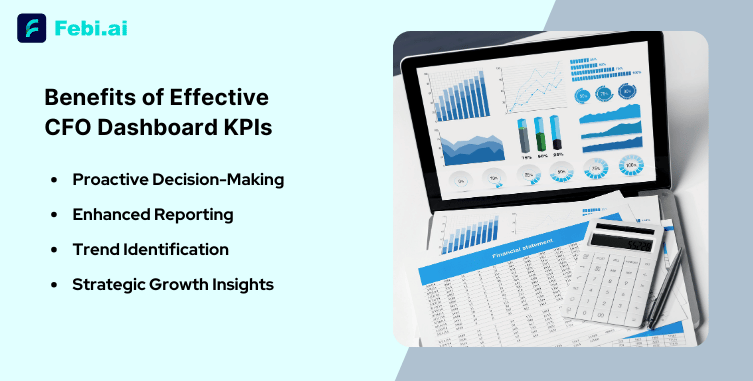
Implementing robust CFO dashboards KPIs offers numerous benefits.
- Clear and real-time picture of financial health, enabling proactive decision-making.
- Enhance executive reporting, offering transparency and accountability to stakeholders.
- Facilitate dashboard analytics, helping identify trends and areas for improvement.
- Empower CFOs with important financial insights needed to drive strategic growth and ensure financial sustainability.
Empower Your Financial Strategy with Febi AI
Incorporating these essential CFO dashboards KPIs into your financial strategy can significantly enhance your startup’s success. For a comprehensive solution, consider using Febi AI. Febi AI provides dynamic financial insights and statements dashboard, automating data collection and visualization to deliver real-time, actionable metrics. By leveraging Febi AI, startups and large enterprises can streamline their financial management, optimize performance, and drive sustained growth. Make your CFO dashboard an indispensable tool for success in 2024 and beyond.