
For every business, clear understanding and effective use of financial ratios is crucial for making informed decisions and assessing the financial health of a business. These ratios prove to be powerful tools that provide insights into a company’s performance, assisting stakeholders to understand its financial stability, efficiency, profitability, and market value. This blog covers the importance of financial ratios, their types, formulas, and practical applications in business management.
Table of Contents
What are Financial Ratios?
Financial ratios are defined as financial tools used to analyze the financial performance and position of a company. They provide a snippet of its health using data from the balance sheet, income statement, and cash flow statement. By examining these ratios, businesses can easily identify strengths, weaknesses, and opportunities for improvement.
Why is Financial Ratios Analysis Important
Financial ratios analysis is important because financial ratios provide insights into the following areas:
- Financial Health: Indicates the overall financial stability and solvency of a business.
- Operational Efficiency: Measures how effectively assets and resources are utilized by the company.
- Profitability: Evaluates the company’s ability to generate profits relative to its revenue and assets.
- Investment Potential: Helps investors and creditors in gaining insights into the performance and making informed decisions about allocating capital.
- Comparison: Enables benchmarking against industry standards and competitors.
Practical Application of Financial Ratios
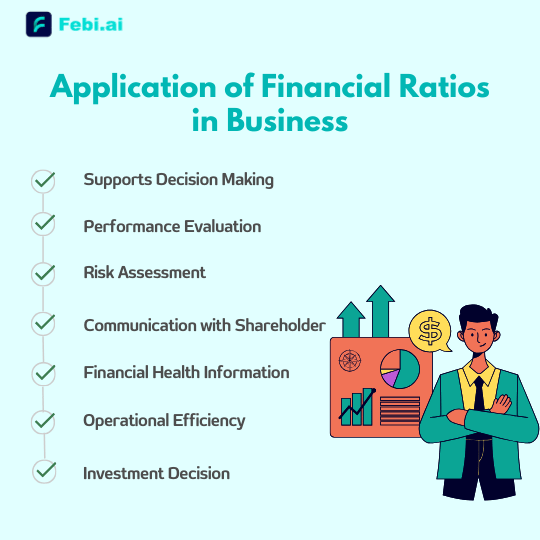
Financial ratios are greatly used by businesses in the following areas:
- Decision Making: Helps in enhancing the decision making process by facilitating strategic planning, budgeting, and forecasting.
- Performance Evaluation: Assesses management effectiveness and operational efficiency.
- Risk Assessment: measures potential risks and possible dangers in financial transactions.
- Communication: Facilitates communication with stakeholders by providing clear and concise financial insights.
- Financial Health: These ratios offer information about how well a business can control its expenses and earn a profit.
- Operational Efficiency: Indicates how effectively the company uses its resources, keeps track of its inventory, and collects payments.
- Investment Decision: Influences investment decisions by offering crucial indicators that investors use in assessing risks and possible returns.
10 Key financial ratios for any business
1. Current Ratio
Also known as working capital ratio, it Indicates the company’s ability to pay its short-term obligations. A higher ratio generally means stronger liquidity. An ideal current ratio is 2:1.
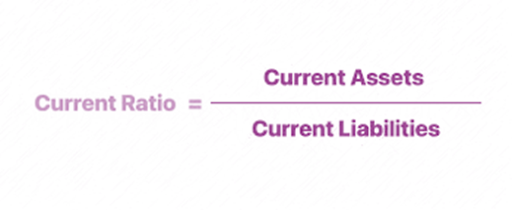
The current ratio is your financial lifeguard, that indicates whether you are well prepared to meet your short-term liabilities. It’s an essential metric for any business owner to keep an eye on, providing a quick snapshot of financial health and readiness to handle immediate debts.
A comprehensive study conducted by Harvard Business School titled “Optimal Financial Ratios and SME Growth: A Comprehensive Analysis” revealed critical insights into the financial health of small and medium-sized enterprises (SMEs). The research identified that SMEs maintaining a current ratio between 1.5 and 2.5 experienced significantly better growth and profitability outcomes. Specifically, these SMEs enjoyed an average annual growth rate of 12%, compared to 8% for those with a current ratio below 1.5 and 7% for those above 2.5.
2. Quick Ratio
It indicates the company’s to meet its short-term obligations without depending on the sale of inventory.
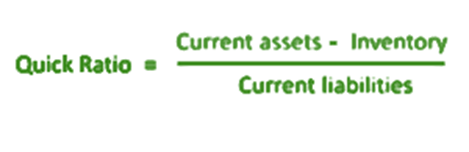
The quick ratio provides clarity in uncertain times. It’s an important tool that indicates whether you are well prepared to handle immediate financial obligations. By keeping a check on your quick ratio, you can navigate through financial storms with confidence, knowing you have the liquidity to keep your business running smoothly.
A study conducted by the Stanford Graduate School of Business titled “Liquidity Metrics and Corporate Financial Stability” revealed significant insights into the importance of the quick ratio. The research found that companies with a quick ratio between 1.2 and 2.0 demonstrated superior financial stability and resilience.
These firms experienced a 30% lower incidence of financial distress compared to those with a quick ratio below 1.2. Additionally, companies with a quick ratio above 1.2 enjoyed a 20% higher market valuation on average, highlighting greater investor confidence in their short-term liquidity. Furthermore, businesses within the optimal quick ratio range reported a 15% increase in operational efficiency, indicating more effective management of liquid assets.
3. Debt-to-Equity Ratio
Measures the proportion of debt used to finance the company’s assets in comparison to shareholders’ equity. Higher the ratio, higher the amount of debt and higher the risk. An Ideal Debt-to-equity ratio is 2:1.
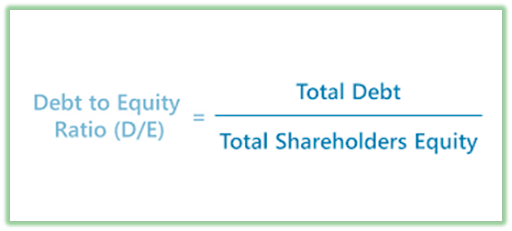
The debt-to-equity ratio is your business’s guide, helping you find the perfect balance between debt and equity. While too much debt can prove to be risky for the business, too little may reduce your chance to tap potential growth opportunities. By keeping a check on this ratio, you can ensure your business performs up to the mark, impressing investors and staying stable no matter what comes your way.
McKinsey & Company’s study, “Debt-to-Equity Ratios and Their Impact on Corporate Performance,” found that companies with a debt-to-equity ratio between 0.5 and 1.5 performed best. These firms achieved a 20% higher return on equity (ROE) and experienced 25% less earnings volatility compared to those with higher ratios.
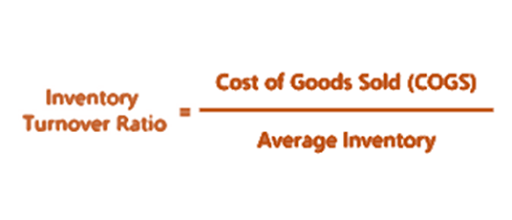
4. Inventory Turnover Ratio
Measures the company’s ability to efficiently manage its inventory by indicating how many times inventory is sold and replaced during a period. Higher turnover ratios show efficient inventory management.
The inventory turnover ratio is a crucial tool for operational success. It helps in efficient sales, manage cash flow, and keep customers happy. By keeping a close eye on this ratio, you ensure your business runs as smoothly as a well-timed kitchen, turning inventory into profit with precision and flair.
5. Price-to-Earnings (P/E) Ratio
Compares the market price of a company’s shares to its earnings per share (EPS). It indicates how much investors are willing to pay per dollar of earnings. A higher P/E ratio indicates high growth expectations.

The P/E ratio offers insights into how the market values a company’s earnings. By understanding this ratio, you can make smarter investment decisions, whether you’re looking for growth stocks or hidden gems.
6. Gross Profit Margin
Gross profit margin is like your business’s fitness tracker—it tells you how much of each dollar earned is left after covering the cost of making your product. Think of it as a measure of how efficiently you’re turning sales into actual profit.

When your gross profit margin is high, it’s a sign that your business is in great shape, managing production costs well, and making good money from each sale. It’s not just about numbers; it’s about understanding how well your business runs at its core.
By keeping an eye on this metric, you can see where you’re excelling and where you might need to tweak things. It’s all about making sure those profits keep sizzling. So, focus on your production efficiency and cost management, and watch your business thrive!
7. Net Profit Margin
Net profit margin indicates the percentage of revenue remaining after all expenses have been deducted. A high net profit margin demonstrates not only operational efficiency but also effective expense management, highlighting the overall profitability of the business.

By closely monitoring this ratio, you gain a comprehensive understanding of your financial health, enabling informed decisions to enhance performance and ensure sustainable growth. Prioritizing net profit margin helps maintain a clear focus on achieving optimal financial results and delivering substantial value.
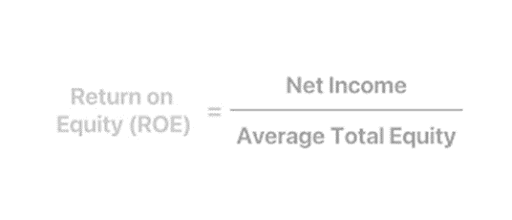
8. Return on equity
This indicates how a company utilizes its shareholders’ money to generate profit effectively. A higher ROE indicates that a company is efficient in profit generation
Return on equity reveals how well your business is using shareholders’ capital to generate profits. By keeping an eye on ROE, you ensure that your company not only creates value from its investments but also stands out as a well-managed and promising enterprise.
9. Earning per share
Earnings per share (EPS) reveals how much profit a company generates for each share of its stock. A higher EPS indicates greater profitability and efficiency in generating earnings for shareholders. This metric helps investors compare companies and make informed decisions. Monitoring EPS provides insight into a company’s ability to create value and its potential for growth. Consistently high or improving EPS signals strong performance and a promising outlook.

10. Return on assets
Return on Assets (ROA) serves as a dynamic benchmark for how effectively your company converts its assets into profits. It’s your efficiency scorecard, revealing how well you leverage resources to generate earnings. By keeping an eye on ROA, you gain insights into operational prowess, compare performance with industry peers, and enhance your company’s attractiveness to investors. A strong ROA signals exceptional asset management and operational effectiveness, providing a clear picture of financial vitality and strategic success.
Conclusion
Understanding and monitoring key financial ratios is essential to gain a clear picture of your business’s performance and making strategic decisions. Febi.ai’s dashboard gives you a real-time view of ratios such as operating expense, accounts payable turnover, operating profit margin, net profit margin, and return on assets, you can optimize operations, enhance profitability, and stay ahead of the competition.
For a seamless way to track and analyze these critical metrics, turn to Febi.ai. Our dynamic financial dashboard offers real-time projections of these ratios, giving you actionable insights to drive your business forward. Experience the power of precise financial management with Febi.ai—unlock your business’s potential today!